Nucleus Learning Network Data Vis Series: Exploring the election
Friday, January 13, 2017 by Sarah Morris, Nucleus Learning Network
Join Sarah Morris, a librarian who co-directs an educational nonprofit called Nucleus Learning Network, as she explores data visualization in a new series.
So much of this past election season was spent poring over maps: from electoral college projections to historic election results to those memes that showed what the electoral map would look like if only the Gilmore Girls voted. Maps, like other types of data visualizations, can tell stories, or condense complex data sets into something digestible. But data visualizations, maps included, can also help you change perspectives.
To engage in this exercise, I used a site called Social Explorer. Social Explorer is a tool that lets you explore data sets and create your own visualizations. All the (interactive!) maps are also at the Social Explorer website. I’ve also embedded images below for reference.
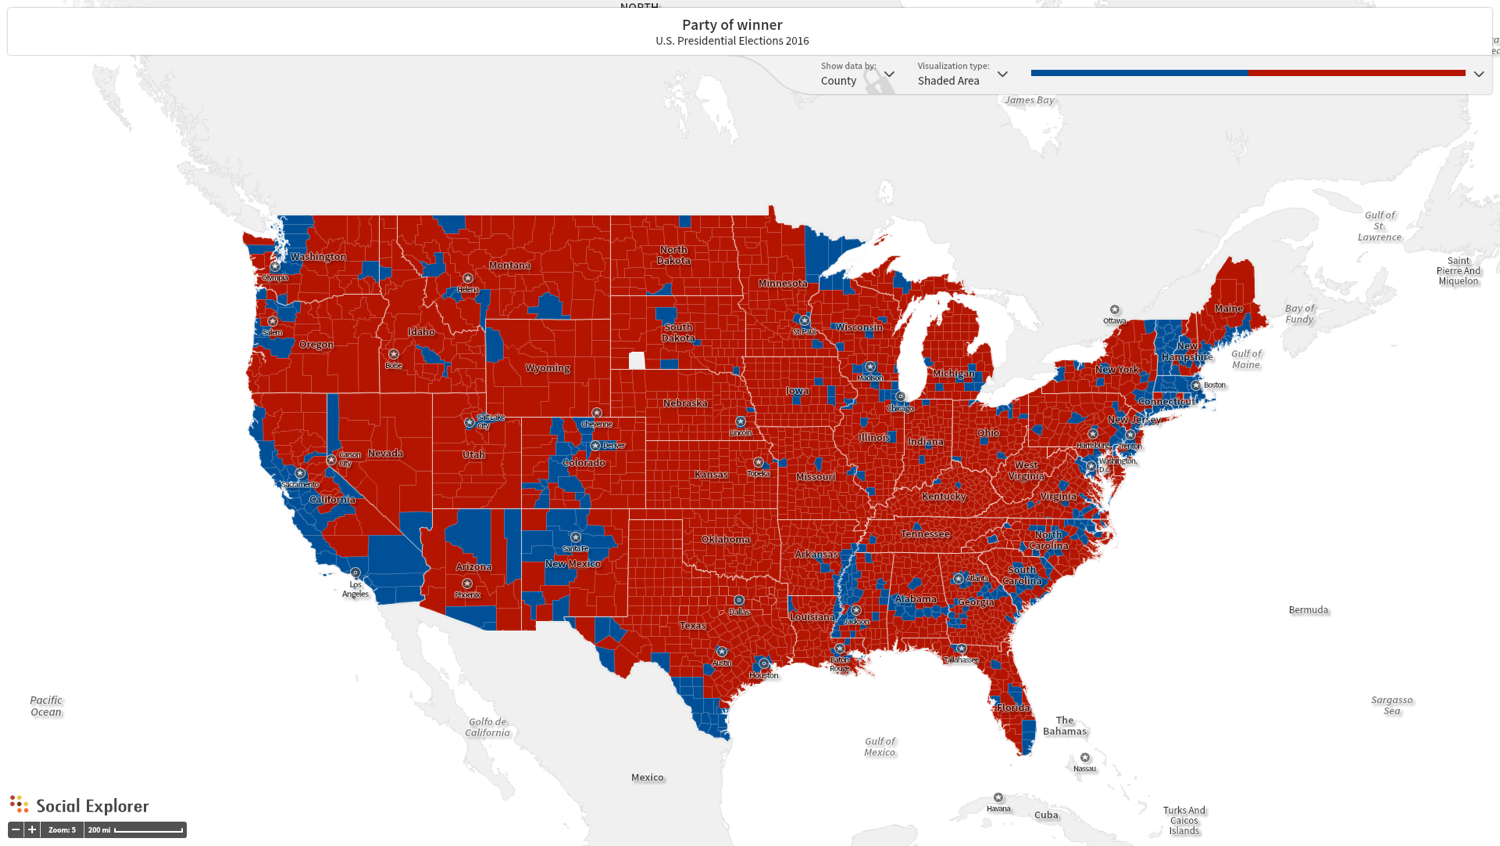
The first map was generated using Social Explorer’s data set on the 2016 presidential election to generate a standard election results map, which we’ve all probably seen. The results are broken down by county here.
The second map is a Bubble Map. Larger bubbles represent larger populations, which helps to illustrate the population spread around the country. Instead of large swaths of uninterrupted red, you get concentrated bursts of blue and areas practically devoid of color in the less inhabited sections of the country.

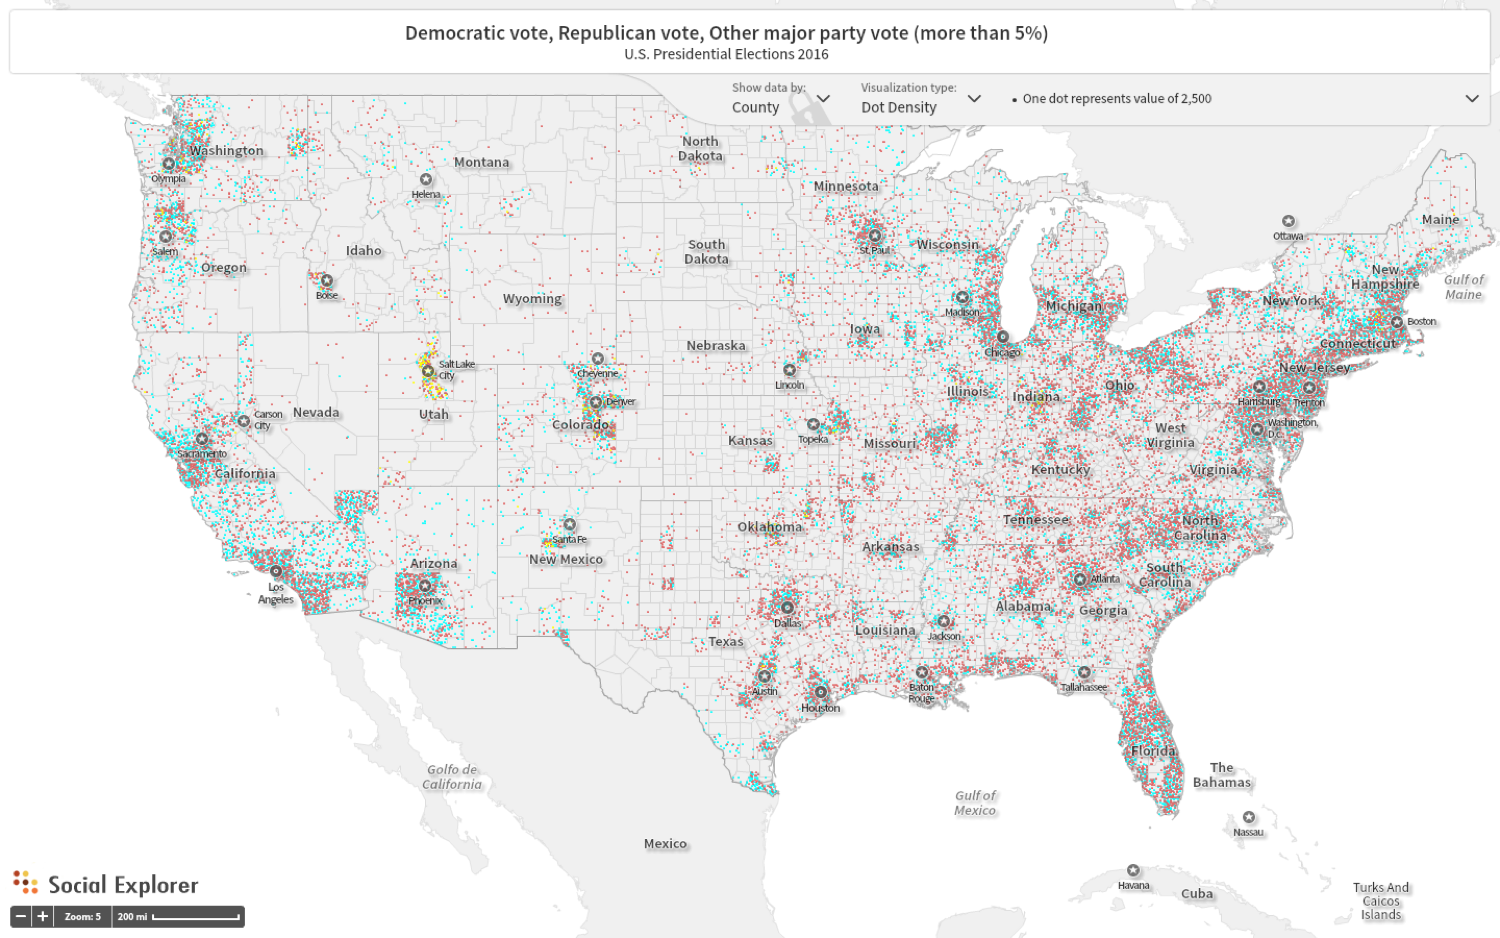
To go more granular, here is a Scatter Plot. One dot represents 5,000 votes. This plot is a good way to show population centers in Texas here, and the concentrations of Democratic votes in many of those population centers. (A note: This visual does not use traditional shades of red and blue for this scatter plot, since blue wasn’t very easy to see. And while you could take that as a metaphor of sorts, you literally couldn’t see the blue dots very well.)
Finally, here is a close-up of Travis County to look at the election results at a more local level. Of note is how everything got blended. There’s a clear majority of Democratic votes (one dot represents 50 votes), but there are Republican votes spread throughout the entire county.
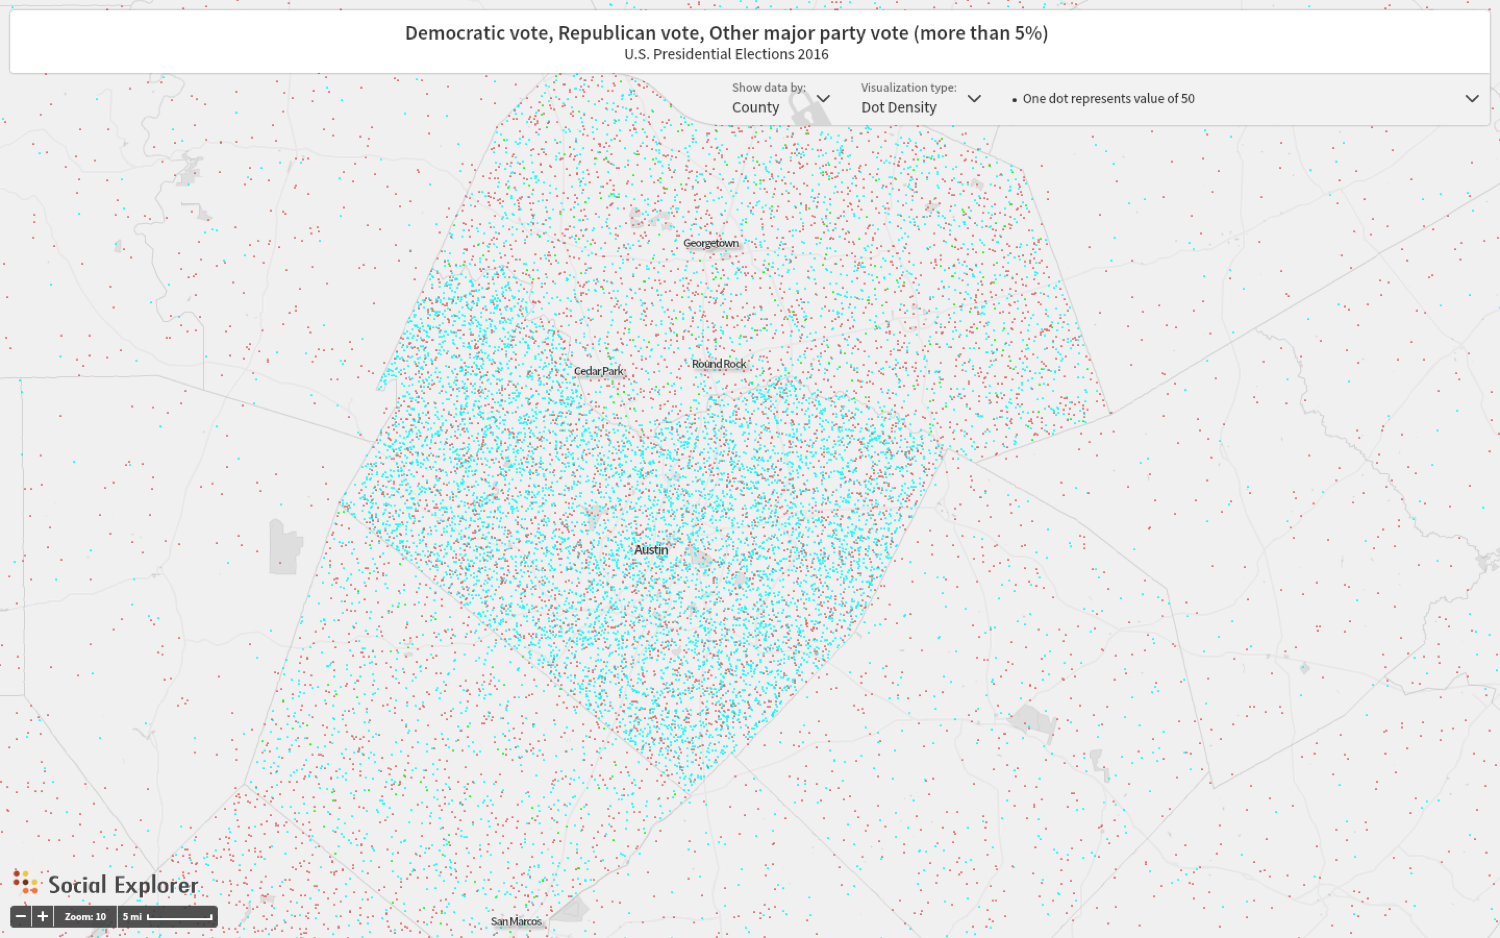
These maps can tell different stories, provide different insights and raise different questions than basic stats, like the fact that Travis County went 65 percent Democrat in the election. And now, with all of that done, there is time to take a break from pondering electoral map issues and make a neon-colored map of what it would look like if only the Gilmore Girls voted.
The Austin Monitor’s work is made possible by donations from the community. Though our reporting covers donors from time to time, we are careful to keep business and editorial efforts separate while maintaining transparency. A complete list of donors is available here, and our code of ethics is explained here.
You're a community leader
And we’re honored you look to us for serious, in-depth news. You know a strong community needs local and dedicated watchdog reporting. We’re here for you and that won’t change. Now will you take the powerful next step and support our nonprofit news organization?